 Images of firing pins which
are illuminated with ring light
Images of firing pins which
are illuminated with ring light
Pattern recognition in a database of cartridge cases
Zeno Geradts, Jurrien Bijhold, Rob Hermsen
Netherlands Forensic Science Laboratory of the Ministry of Justice, Department Forensic Information Technology,
Volmerlaan 17,
2288 GD Rijswijk, Netherlands email zeno@holmes.nl
In the forensic science laboratory in the Netherlands a research study has been done for automated comparison algorithms of cartridge cases. This study was a part of evaluating the different systems, which exist on the market for databases of cartridge cases and bullets. These systems are Drugfire and IBIS.
When a firearm is loaded and fired the mechanisms and part in the firearm which come into contact with the cartridge case or bullet cause impressions and striations that can be characteristic for the firearm being used. The striation marks on bullets are caused by the irregularities in the gun barrel as well as larger and more distinct land and grooves of the rifling.
The cartridge case ejected will also have marks, which are caused by the firing pin, the breech face as the cartridge is repelled back in the breach by the force of rifling. The feeding, extraction and ejection mechanisms of the firearm will also leave characteristic marks.
In the forensic science laboratory these marks on cartridge cases and bullets are compared with the test fired ones. Often the cartridge case is the most important forensic specimen in the identification of weapons, as bullets are commonly deformed by the impact. The examiner can also determine based on class characteristics what kind of firearm or which make and model has been used.
This study handles the different approaches that can be used for comparison on image databases of breach face and firing pin marks. Further we have some other ideas which can be used in these systems for comparison.
We have evaluated the use of Drugfire and IBIS.
Other systems that have been described on the market are the system Fireball and the French system CIBLE. We have not evaluated these systems.
For our evaluation of comparison algorithms we studied on two kind of images:
Images of firing pins which
are illuminated with ring light
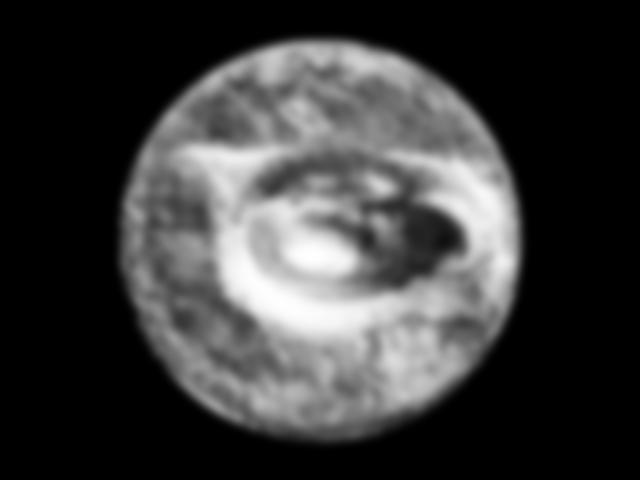
Image of Breechface Image of firing pin with ring light
Figure 3 : image of breechface and image of firing pin with ring light
We used a database of approximately 3900 images, which were acquired by Drugfire under different circumstances. We tested the algorithms on all images (without prior knowledge). We selected two cartridges case which were fired with the same gun with striation marks (9 mm Luger) that is found 15 times in the database under different light conditions.
We have a Dutch matching pairs test of test fired cartridge cases. These cartridge cases are fired from firearms that are sent to the laboratory for investigation between 1990 and 1996.
The test database consists of 50 pairs of 9-mm Parabellum cartridges. An attempt is made to select 50 pairs which would be good reflection of the average case of which are investigated at our laboratory.
The database is exported to a Linux system. We have used parts of the Khoros imaging software, together with some routines to evaluate the results for the visualization of the hit list.
4. Preprocessing


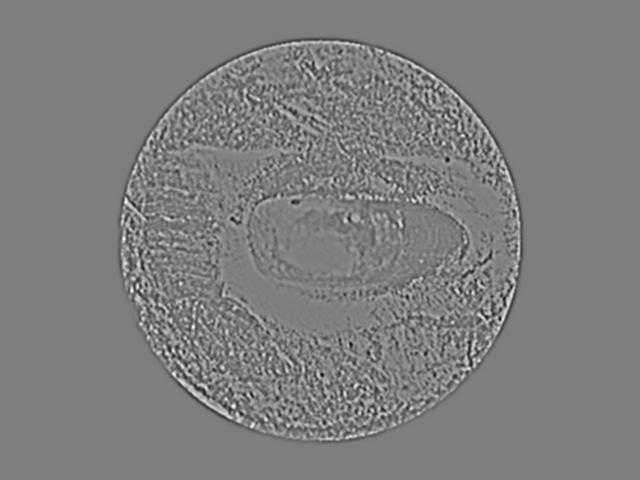
Figure 4 : preprocessing operation (left : original image, right : processed image)
We first equalized the images, since it appeared that the conditions of lighting differed for the cartridge cases.
We used histogram equalization:
This appears to be necessary for this comparison, since the images are acquired with different settings in light.
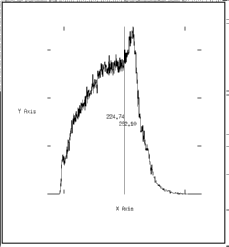
For the general image of a cartridge case we have the function g(x,y) which is the gray-value on position g(x,y). Since we would like to compare just the inner circle of the image (were most impression marks are), we select the circle and outside of the circle the gray-value is zero (figure 2)
6. Comparison
For this research we tried to use the normal correlation techniques which are available from the literature and used some more sophisticated methods as the multiresolution approach. We did not use any signature technique for comparison, since we tried to use the information of the greyvalues in the image.
6.1 Difference of two images
For a simple kind of comparison we can take the variance of the difference (which is also used in previous research for toolmarks.
![]() (1)
(1)
 (2)
(2)
were N is size of image in pixels in x-direction, M is size of image in pixels in y-direction, m is the mean.
Sort this variance and the hit list is the lowest variance.


Figure 5 : subtraction of two cartridge case images
In the database the most similar images are identified. 14 images were in the first 20 positions of the hitlist. One cartridge case that was positioned somewhat tilted was in the first 5 percent of images.

 This
method can be very useful for rotation invariant comparison. Further, by
rotating the images more can be calculated. A
This
method can be very useful for rotation invariant comparison. Further, by
rotating the images more can be calculated. A
Figure 6 : histograms of greyvalue of substraction of two images
Left : which are almost positioned the same
Middle : which are positioned with an angle of 5 degrees
Right : different cartridge cases
problem rotating and comparing takes much processing power. Since the user of the database has to position the cartridge cases with rules, it might be positioned 180 degrees rotated. Also small rotation angles are allowed. We tested the results by rotation of the cartridge case. It appeared that a small rotation of 5 degrees is allowable.
6.2 Correlation-parameter
For a better statistical approach we use the correlation coefficient which is
 (3)
(3)
-1 < r < 1
If r = 1 then f and g agree with each other
If r = 0 then f and g do not agree with each other
The results for a cartridge case with our test case were that 14 out of 15 images were correlated in the first 14 positions. The slightly tilted cartridge case was found in the first 3 percent.
6.3 Invariant Image Descriptors
A problem is that the above algorithms are translation and rotation variant. A classical technique for registering two images with translatory misalignment involved calculating the 2D cross-correlation function
The maximum of this function represents the translation necessary to bring the images into alignment. This function has the disadvantage of being sensitive to rotation and scale change. Even small rotations of a few degrees can reduce the peak of the cross correlation function to the noise level.
By using the invariant image descriptors in place of the original images, it is possible to avoid this problem. One such descriptor is the log-polar transform of the Fourier magnitude, which removes the effect of translation, and uniform scaling into depended shifts in orthogonal directions.
In order to demonstrate the properties of this triple invariant image descriptor, consider the comparison between two images f(x,y) and g(x,y), which are related by a four-parameter geometric transformation :
g(x,y) = f(a (x cos b + y sin b ) - D x, a (-x sinb + y cosb ) - D y (4)
The magnitudes of the Fourier transform are invariant to translation, but retain the effect of scaling and rotation :
![]() | (5)
| (5)
Were G(u,v) and F(u,v) are the Fourier Transforms of g(x,y) and f(x,y) respectively.
Mapping of the Fourier magnitudes into polar coordinates (r,q ) achieves the decoupling of the rotation and scale factors; rotation maps to a cyclic shift on the q -axis, and scaling maps to a scaling of the r-axis:
![]()
![]() (6)
(6)
Were
![]() A logarithmic transformation of the r-axis further
transforms scaling into a shift :
A logarithmic transformation of the r-axis further
transforms scaling into a shift :
![]() (7)
(7)
Were r =ln(r). The polar mapping followed by the logarithmic transformation of the r-axis is called the log-polar transform.
The optimal rotation angle and scale factor can be determined by calculating the cross-correlation function of the log-polar transformed Fourier magnitudes of the two images. It is important to note that the cross-correlation needs to be circular along the q -axis, and linear along the r -axis:
![]() (8)
(8)
Were F(r ,q ) is equal to F(F(r ,q modulo 2p ) and XC(R,T) is the two-dimensional cross-correlation function, with parameters R (difference in logarithm of scale factors) and T (difference in rotation angles).
The q -axis-circular and r -axis-linear cross-correlation can be readily achieved by zero-padding only the r -axis direction and performing a circular cross-correlation with an FFT-based algorithm.
If the valid range of rotations is not known a-priori then an additional cross-correlation may be necessary to remove the 180 degrees ambiguity in the rotation angle, because the Fourier magnitude of a real-valued image is an even function.
It is important with respect to the implementation of the triple invariant image descriptor algorithm the choice of the number of samples in the log-polar-domain. This number is based on a realistic memory requirement and a realistic representation in the log-polar-domain.
One way to approach the spatially variant resolution of the log-polar domain is to have the worst-case resolution equal to the log-polar domain equal the resolution in the rectangular domain. The log-polar domain resolution elements are :
![]() (9)
(9)
Where
D q : the resolution elements in angular direction
D r : the resolution elements in logarithm of radius-direction
D l : the arc length between neighboring points in the rectangular domain
D r : the resolution element in the radius direction
r : the radius coordinate
The worst case resolution in the log-polar domain is the minimum value of D q and D r .
The number of samples in the log-polar domain necessary for the preservation of the information content:
![]() (10)
(10)
(11)
In many imaging applications the signal is limited to mostly lower frequencies, and the noise is in the higher frequencies.
We can also sort this one and it appeared that this works fine for the different results. Since we are working rotation variant, we had a solution on which we rotated the image. We did a limited test with a firing pin mark. Two firing pins from the same gun were correlated. They were rotated by 60 degrees, and they appeared in the top two positions of the list.
6.3 Invariant moment calculation
The method of calculation of invariant moment calculation methods was also investigated. This method appeared to be very insensitive to detail and sensitive to light variation. Another disadvantage is that it takes much computing power.
6.4 Multiresolution
There is a huge number of articles with pattern recognition which is based on wavelet transforms. A wavelet transform is a localized function of mean zero. Often wavelets incorporate a pyramidal visualization. Wavelet transforms are computationally efficient and they allow exact reconstruction of the original data. Wavelet functions are often wave-like but clipped to a finite domain.
 The wavelet can however
introduce artifacts. A wavelet for discrete data is the version known as a
trous (with holes) algorithm. This is a redundant transform, since decimation
is not carried out.
The wavelet can however
introduce artifacts. A wavelet for discrete data is the version known as a
trous (with holes) algorithm. This is a redundant transform, since decimation
is not carried out.


1 2 3 4
Figure: 4 scales of the original image (above) computed with an a trous wavelet transform
The scale 1 of the � trous will give the finest details of the image. Depending on the details which has to be correlated the different scales can be used.
We correlated all images with the different scales. It appeared that for this image the scale 3 would have the best results in which all images will be in the first 10 positions. Further research has to be done to evaluate the different statistical means and other transform that can be used for this problem.F
7. Further research
The comparison algorithm, which is used, depends very much on the kind of markings in a cartridge case. If there are prominent marks, the simple correlation techniques can be used. A way to make a further comparison is with some artificial intelligence in which a different type of correlation technique will be used depending on the kind of markings. Our Dutch database will be investigated further, and other comparison algorithms will be implemented and tested.
Further it is very important how the cartridge case is positioned under the camera. If the user does not satisfy with the exact procedures, the cartridge case will not be found. One way to improve this, is to rotate the cartridge case, and image step by step a rotation. This procedure can be automated, and will give a convenient way of dealing with all 3D-information in the cartridge case that is known to the firearm examiner. The problem with this approach is however that many comparisons have to be dealt with. This can be
In future research the use of a line scanner instead of ring light or coaxial light might be worthwhile to evaluate for the markings. The use of other 3D-means, like structured light (currently under investigation at our laboratory) and laser scanning are also worthwhile to evaluate for the acquiring an image. The use of optical processors is an option to improve the speed of the correlation's.
8. REFERENCES
1. Jones, B.C.;"Intelligent Image Capture of Cartridge Cases for
Firearms Examiners", SPIE Vol. 2942, 1997, pp. 94-104.
2. Baldur, R.;" Method for monitoring and adjusting the position of an
object under optical observation for imaging", patent US5633717
3. Baldur, R.;"Method and apparatus for obtaining a signature from a fired
bullet", patent US5659489
4. Baldur, R. " Fired cartridge examination method and imaging
apparatus" patent US5654801
5. Baldur, R.;" Computer automated bullet analysis apparatus", patent
US5390108
6. Smith, C.L.; "Fireball : A forensic Ballistics Imaging System",
Proceedings of the IEEE International Carnahan Conference on Security
Technology, pp. 64-70, 1997
7.Khoros, University of New Mexico, www.khoral.com
8. Smith, C.L. e.a.;"Optical imaging techniques for ballistic specimens to
identify firearms", Proceedings of IEEE International Carnahan Conference
on Security Technology, 1995, pp. 275-289
9.Geradts, Z; Keijzer, J. ; "A new approach to automatic comparison of
toolmarks", Journal of Forensic Sciences, Vol. 39, No.4 , July 1994
10. Anuta, P.E.; "Spatial Registration of multispectral and multitemporal
digital imagery using fast Fourier transform techniques", IEEE Trans Geo
Elec, 8:353-368, 1970
11. Casasent, D, Psaltis, D; "Position, rotation and scale invariant
optical correlation", Applied Optics, 15:1795-1799, 1976
12. Goshtashby, A; "Template matching in rotated images", IEEE
transactions on pattern recognition and machine intelligence, Vol;. PAMI-7,
No.3, May 1985, pp. 383-344
13. Starck, J.L.; Mortagh, F; Bijaoui; "Image Processing and Data Analysis,
the Multiscale Approach", University Press, Cambridge, ISBN 0 521 59914 8,
1998
14. Holschneider, M e.a.; "A real-time algorithm for signal analysis with
the help of the wavelet transform", in J.M. Combes e.a., eds. Wavelets:
Time Frequency Methods and Phase Scale", Springer Verlag, Berlin, 1989, pp.
286-297
15. Zographos, A, Robnson, M., Evans, J.P.O, "Ballistic Identification
using line-scan imaging techniques", ", Proceedings of IEEE
International Carnahan Conference on Security Technology, 1997, pp. 82-87
16. Karins, J.P.; Mills, S.A.; Dydyk, R.B; "Optical processor for
fingerprint identification", Proceedings of the SPIE - The International
Society for Optical Engineering Conference Title: Proc. SPIE - Int. Soc. Opt.
Eng. (USA), vol.2940 p.108-115
17. Perez-Poch, A.; Velasco, J.; "Cheap and reconfigurable PC-board for
real-time optical applications using liquid crystal displays", Proceedings
of the SPIE - The International Society for Optical Engineering Conference
Title: Proc. SPIE - Int. Soc. Opt. Eng. (USA)vol.2774 p.757-65